September 30, 2017

How does a straw really work?

Most people don't think about how straws work or believe that they are somehow pulling the liquid up in some way.    But the truth is that atmospheric pressure is doing the "heavy lifting".   And did you ever wonder how tall could a straw be?

These serious issue were ones I talked about in Atmospheric Sciences 101, which I am teaching now at the UW.

One starts with a straw in a liquid.  The liquid doesn't move by itself, obviously.  There is pressure on the liquid...atmospheric pressure, which is typically around 14.7 pounds per square inch (psi) near sea level.  This pressure is communicated into the liquid.  Since the straw is open to the atmosphere, the same pressure is pushing down into the straw.


So, there is no reason for the liquid should rise in the straw since the pressure of the liquid is the same as the air pressure in the straw.  

But now the fun starts.  A human puts her mouth on the straw and starts to suck air by expanding her diaphragm;  sucking the air causes the pressure in the top part of the tube to drop.   What is the limit for humans in reducing pressure in a straw by sucking?  Checking around on the web, the general finding was that a human can drop the pressure about half...to around 7 psi.

So we have full pressure (14.7 psi) in the liquid, but substantially less than  that in the straw.  Thus, there is a difference in pressure and fluids (and air) are moved by differences in pressure, moving towards lower pressure.  Thus, the liquid thus rises in the straw (see below).


If there was no atmospheric pressure, we would not be able to use straws, although that is kind of academic since without pressure our demonstrater would not be alive.

The insightful among you would note that the fluid in the straw has weight, which contributes to a downward pressure.  It turns out that a vertical column of 30 feet (about 10 meters) would produce a downward force equal to typical sea level pressure (again, about 14.7 psi).  So, even if one could create a total vacuum in the upper portions of the straw, one could never suck a fluid higher than 30 feet--not that anyone is interested in such long straws!

But this issue does effect the depth that suction pumps can draw up water.... again, no more than 30 feet (and actually that is not possible since pumps are not perfect).  This Honda suction pump can only do 23 ft.
You will never think of a straw the same way.

September 28, 2017

Last 80F Day of the Year in Seattle

It is kind of sad.  

Today, accompanied by glorious heat and sun, was probably the last day above 80F until next spring

Fortunately, our last warm day was announced by something very special:   an amazing auroral display last night.

First, the temperatures.  Today's high temperatures got into the mid to upper 80s around much of western Washington (see map).  The light reds are 80F and above, dark reds 90 plus.  Sea-Tac got to 86F.  Amazing.


A number of locations around the area (like Sea Tac) achieved their record high temperature for the date, with high temperatures 15-20F above normal.

Why so warm?  Warm air associated with a ridge of high pressure and moderate offshore (easterly) flow, which kept the cool ocean air offshore (see winds and temperatures above Sea Tac below).  Easterly flow also caused warming as air subsided over the western slopes of the Cascades and Olympics.

The situation is about to change radically, and a front is poised to move in on Friday (see satellite image a 8 PM). And models promise strong onshore flow and a series of weather disturbances.  You won't have to water your lawn or bushes anymore.


Now why do I think our 80F days are over?  First, virtually all the ensemble forecasting systems, which run forecasts many times to get at uncertainties, shows a cool down over the next 8 days, with temperatures not getting much out of the 60s. The temperatures predicted at Seattle from the NOAA/NWS GFS model illustrates this below.
And after that, it is simply too late to get very warm, with the sun weakening and the nights getting longer.  To illustrate, this plot shows the record highs at Sea-Tac (yellow), based on daily records.  In September, the record highs can get to around 90F, but the bottom drops out during October, and after around October 12th, Sea Tac never has got to 80F.  Depressing, but true.


But our depressing future cool down is at least made more palatable by the stunning aurora of last night.  Here is an image provided by Greg Johnson of Skunk Bay Weather, on the north side of the Kitsap Peninsula.   A video link is here.


September 26, 2017

The Last Warm Days of the Year

Today in the Northwest was as close to perfection as one could get:  a high of 74F in Seattle, with much of western Washington in the 70s (see map of today's max temps).  Sun, no smoke.


We have two lovely and even warmer days ahead, with Seattle zooming up to around 80F on Wednesday and Thursday.  The origin of this boon?  A temporary ridge of high pressure over the West Coast (see upper level map for tonight at 11 PM).

But everything changes on Friday as the ridge is replaced by an approaching trough...and no ridge is coming back for two weeks (as far as we have forecast skill).  And then it becomes too late for sustained real warmth (75F and more), as the days shorten and the sun weakens.   Here is the Weather Channel (weather.com) forecasts for the next two weeks.  Highs only reaching into the upper 50s by the end.


What about the North American ensemble combining U.S. and Canadian extended range forecasts (see below) through October 10th?  The top panel is temperature (C), followed by precipitation, wind speed, and cloud cover.  The range  of the ensembles is shown by the "whiskers"  and 50% of the forecasts are within the yellow bars.

The ensemble are united in predicting the warming, followed by a cool down for several days.  Then a modest warming, but not back into the 70s.   Light rain on and off.

There is still plenty of water in Seattle's reservoirs (see figure), and the Yakima

River System is above normal (also see below) due to the bountiful spring rains.


But water levels are dropping rapidly (which is normal) and it is time for the fall refill.  

September 24, 2017

Resilience to Extreme Weather and Climate Change: Can This Be a Bipartisan Effort?

The news the past several months has been full of disasters associated with extreme weather and wildfires.  Hurricanes Harvey, Irma, and Maria.  Flooding in Houston, power outages in Puerto Rico.  Wildfires in the Pacific Northwest.

The media and some politicians often suggest that global warming is a major explanation for many of these contemporary disasters.  As noted in previous blogs, I believe that scientific evidence and reports by authoritative groups (e.g., the IPCC) suggest a much more nuanced conclusion about global warming's role in recent weather-related disasters.


Specifically, global warming has played only a minor role in enhancing some of the recent extreme weather events, and that the current problems are mainly the result of poor infrastructure, inadequate planning, and the lack of resilience.  This is particularly true for the Pacific Northwest, downwind of the slowly changing eastern Pacific Ocean.

Our society is not resilient to past and current weather extremes, ones driven overwhelmingly by natural variability and not by human-caused global warming.  So instead of the partisan fighting about the impacts of global warming, which has resulted in little progress, why not work together as a State and a nation to make ourselves more resilient to the current climate and extreme weather?

 Furthermore, putting the blame on global warming has allowed politicians, major institutions, and others to shuffle off their responsibilities in allowing inadequate infrastructure and planning regarding to current extreme weather. Easy to point the finger at global warming and not their failings.

Lack of Resilience is Obvious

Outside of the Pacific Northwest.

Houston has had a number of floods during the past few years and it is clear that lack of planning for heavy rain and abysmal infrastructure has been the primary cause of the problems.

New Orleans flooded during Katrina for many reasons, including inadequate, poorly constructed, and poorly maintained levees, destruction of protecting wetlands, and subsidence from the use of underground aquifers and drilling operations.

In New York City during Hurricane Sandy, subways flooded due to inadequate watertight doors, power failed due to poor placement of electrical infrastructure, and homes located in inappropriate coastal locations were flooded.

In Puerto Rico last week, massive power outages have occurred due to an irresponsibly neglected power system.

In California, the Oroville Dam spillway failed after a heavy rainfall event.  Poor construction and lack of maintenance were the key issues.

There is a virtually an  unlimited number of examples of this:  lack of planning and poor infrastructure has made millions of people vulnerable to current extreme weather.

The Pacific Northwest

 Our region has done relatively little to deal with susceptibility to the effects of weather extremes.

Take wildfires and smoke.    There has been several major fires during the past several years and a number of media outlets/politicians have been pointing the finger at climate change.

Wrong direction.   Temperatures in our region have only warmed up about 1 F during the past several decades and precipitation/snowpack has remained steady over the period (little trend).

But our forests east of the Cascade crest are in terrible condition and prone to burn.  We have suppressed fires for over a half-century allowing unhealthy conditions to develop, with lots of debris on the forest floor and excessive density of timber. Invasive cheatgrass (grassoline) has replace much of the less fire-prone natural bunch grass.

Too many people have been allowed to build homes and buildings in and near forests, endangering them and those sent to protect their homes during wildfires.

Our current State leadership has been irresponsible in this area, investing far less in restoring forest health than other states, and even opposing US Forest Service attempts at expanding proscribed burns.   Instead, they have pushed an ineffective agenda regarding global warming.  And little has been done to discourage building at the urban/forest interface.


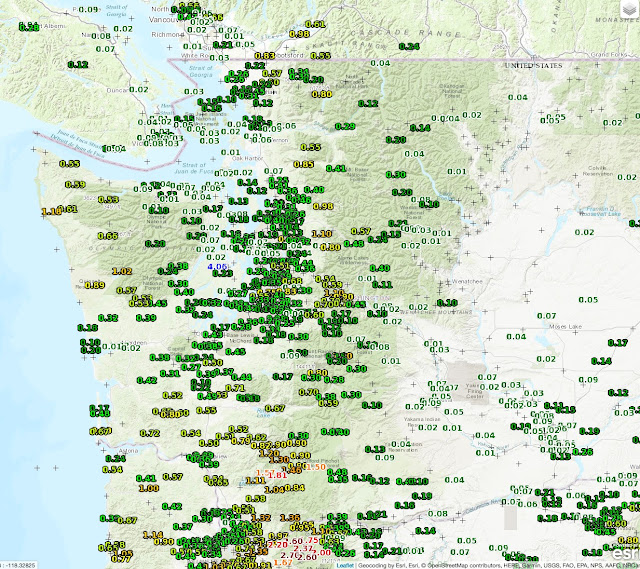
Heavy rain, flooding and landslides.   Our region can get heavy precipitation during the winter from atmospheric river events, some with 10-20 inches over a few days.  The result is flooding near rivers and slope failures .  In the future, global warming will enhance the most extreme global rivers by 30-40% (I have done research on this with Mike Warner, of the US Army Corps of Engineers).

Our region is not prepared for even current rain events.   Recently, a very modest rain period caused the failure of King County's West Point treatment plant, resulting in a catastrophic ejection of raw sewage into Puget Sound.

The State and local government agencies allow folks to build in vulnerable locations, such as the homes in Oso, WA that were wiped out a few years ago.

 Too many people live near rivers in highly vulnerable locations.  For example, there are a number of communities living next to rivers, including in bends of rivers (see an example for Big Bend, WA near the Skykomish River, as an example).  Disasters waiting to happen.


The State must identify all vulnerable areas to flooding and landslides, prevent future construction at such sites, and begin the process of buying out vulnerable properties.  This is will not be cheap, but the process needs to start immediately.

Water Resources

During the past fifty years there has been no downward trend in precipitation or snowpack over the Northwest, although there have been some poor years in one or the other (such as the warm temperatures and poor snowpack of 2015).

 Models indicate that global warming will slightly enhance annual precipitation, but significantly reduce April 1 Cascade snowpack by the middle-end of the century.   The Columbia River will be less affected by the warming since many of its sources are from higher terrain.

During the 2015 warm summer, water resources were stretched for the Yakima Valley and for some cities near the Olympics.  There were substantial agricultural losses.  To deal with these issues, more efficient use of water in agriculture (e.g, more drip irrigation, less water-intensive crops, reduce loss/waste) is needed as well as enhanced reservoir capacity, something this being discussed/planned as part of the Yakima Valley Integrated Water Management  Plan.  A statewide plan for dealing with occasional dry years is needed immediately, with extensive planning and infrastructure development for the second half of the century when temperatures will be warmer (more evaporation) and snowpack will decline.

A Key Resource for Resilience and Adaptation:  Knowing the Past and Future

To take the necessary steps to make our region more resilient to the current climate and to prepare for future changes, society needs information on the nature of historical extremes and our best projections of what will occur as the planet warms.   Unfortunately, our state is not investing sufficiently in these areas.

The Office of the Washington State Climatologist (who is Nick Bond) is acutely underfunded and can not collect and make available comprehensive and up-to-date climate information.  The State has not invested in regional climate modeling, an effort that several of us have been trying to spin up.   A modest State investment in documenting past climate information and producing improved projections of future climate, will greatly enhance regional resilience efforts.

Emergency Assistance

Finally, resilience also represents the ability of the nation and world to effectively and quickly move in supplies and assistance to locations where disasters occur.  How effective we are in this area is being tested in Puerto Rico, whose infrastructure was decimated by Hurricane Maria.  The U.S. needs to have a large rapid response infrastructure to bring food, water, and assistance to those facing environmental disasters, and the ability to provide extended assistance with housing and other needs. There has been suggestions that our region is woefully unprepared for the next major earthquake or for an historical record flood.


Many of the above suggestions should be of interest to folks on both sides of the aisle.  Don't believe in global warming?   You can still support making our society resilient to current extreme weather.  You can support getting better climate information.   A middle ground is possible...


September 22, 2017

Autumn Starts Today Following the Driest and Warmest in Seattle Records

Autumn started today at 1:02 PM, with night and day being equal; thus it is given the name autumnal equinox.   The other neat thing about today is that the border between day and night, called the terminator, is oriented exactly north-south, as seen in the following visible satellite image:


As suggested in my previous blog, this is a summer for the record books.    As shown by a table prepared by the Seattle National Weather Service forecast office, Seattle-Tacoma Airport had the driest summer on record, with only .52 inches.    This table has an issue...they combine the downtown Seattle and Sea-Tac records (Sea Tac only goes to 1945), which is really a problem since the precipitation climatology of the two is different.  As shown in my previous blog, the lowest previous summer precipitation at Sea-Tac was 1.28 inches, making this years record even more impressive.


The summer was also very warm, and we tied the record for average summer high with 78.6F.

Really quite an amazing year, with the wettest winter on record and the driest summer on record.  Both were due to persistent upper atmospheric flow anomalies (differences from climatology).  This summer a persistent ridge of high pressure was parked over us, with a trough of low pressure over the eastern U.S.  They were unusually cold and wet, we were unusually warm and dry.  

Why such anomalies?   We don't know.   Could be typical chaotic behavior of the atmosphere.  At this point, there is no reason to believe such patterns are associated with global warming--climate models forced by increasing greenhouse gases don't produce them.  

Our feathered friends know the season is turning, with a massive southward migration going on.  How do I know. Weather radar!

Here is the radar image from 11:03 PDT last night.  Lots of echo..but no rain.  Those are birds.  How can I be sure?  There was no echo before sunset and then the radar let up as it got dark.  Lots of birds prefer to fly after dark.  Probably safer for them (predators can't see them well) and perhaps they use the stars for navigation.

Weather radar even tell us which direction the birds are flying using the Doppler velocity output. Here is the Doppler Velocity at roughly the same time using the Camano Island radar.  It tells you the component of motion towards or away from the radar.  Cold colors (like blue) indicate incoming, warm colors (orange/yellow) for outgoing.   Clearly, our feathered friends are heading south.


September 20, 2017

The Driest Summer in Seattle's History

I am now entirely confident in this. We are going to break a major record in two days:

The driest summer in the history of observations at Seattle-Tacoma Airport.

And we are not simply going to beat the record, we are going to smash it.


Let me give you the numbers.   Logan Johnson, head of the NWS forecast office in Seattle, provided these number for the driest calendar summers (roughly June 21st-Sept 21st) at Seattle-Tacoma Airport:

1988 1.28"
1987 1.33"
2000 1.36"
1990 1.39"

Seattle-Tacoma Airport records go back to 1945-- so over 70 years!

As of noon today (Wednesday June 20th), Seattle-Tacoma Airport has received only .50 inches of rain. LESS THAN HALF of the previous summer record.  And most of the rain is over for a while.

According to the latest forecast model runs, it is possible that we could get a few sprinkles today, but nothing of any significance.   Here is the latest NWS SREF (short-range ensemble forecast) that show the cumulative precipitation prediction at Sea-Tac for a number of model runs starting 5 AM this morning.  No model run provides enough to threaten our record (most produce a few hundredths of an inch).


Folks--we have this in the bag....the driest calendar summer in Sea-Tac Airport history.  

Here is a plot of the observed (purple) and normal (blue line) precipitation at Sea-Tac.  We are about 3 inches behind for the summer!
Another way of appreciating our dry conditions is the following figure, showing the percent of average precipitation since June 21st.  Most of Washington State is below 25%, with some below 5% of normal.


Why have we have been so warm and dry this summer?  The same reason the eastern U.S. has been cool and wet:  an anomalous upper level wave pattern, with high pressure over the west and low pressure over the east.   This is illustrated by the upper level height anomalies (difference from normal) for 500 hPa (about 18,000 ft) for the past 90 days.
The yellow/orange colors indicate higher than normal pressures/heights. Blue the opposite.

Some folks will get upset with me for saying this, but there is no reason to believe that such a pattern has anything to do with global warming.

September 18, 2017

Normal Weather Returns to the Northwest (Hint: Mountain Snow, Heavy Rain, Wind, Clean Air)

Just when folks thought that heat and smoke would continue forever, normal weather returned to the Northwest.

Let's see....we had light snow above 5-6 thousand feet, providing a dusting at Timberline Lodge.

Air quality improved over nearly the entire region (green circles) as strong onshore flow brought in clean air and the cool/wet weather put down the current fires.


The infrared satellite imagery shows one system after the other, with an upper level trough and very unstable air moving through the region, bringing heavy showers and even some lightning, as I write this.


The radar image for around 8 PM (Monday) shows bands of moderate to heavy (yellow-orange) precipitation moving through.


And the precipitation totals for the 24h ending 7 PM Monday show rain all over the region, with some places (western Olympic Peninsula and the southern WA Cascades) getting over a inch.  Some locations east of Portland got two inches.  The weather gods want to stop the fires in the Columbia Gorge.


The cause of all this frisky weather?  An upper-level trough that replaced the unending upper level ridge of the western U.S. (see below)


 But there is still a possibility we could achieve an amazing record:  the driest calendar summer (June 22-Sept 21) in the history of Seattle.  

Yes, it is still possible.  The record is .58 inches.  So far we have had about .30 inches.  More rain is coming...   Keep your fingers crossed.


September 16, 2017

La Nina and This Winter's Weather

I am always nervous about predicting the character of the upcoming winter's weather for a number of reasons.  Seasonal forecasting skill is not good, with our long-range numerical models having very little skill past three weeks. Furthermore, our main seasonal forecasting tool with any skill, the relationship between El Nino/La Nina and local weather, only explains some of the interannual (between years) variation.  In addition, the state of the tropical Pacific (which determines whether we are in El Nino, La Nina or La Nada) often changes during the spring/summer.

Earlier in the year it appeared that we would have a neutral (or La Nada) winter, but recently the waters of the tropical Pacific have cooled and the National Weather Service has released a La Nina Watch (see below).

La Nina is associated with cooler than normal waters in the central and eastern tropical Pacific Ocean, with enhanced easterly trade winds near the equator and the shifting of convection (thunderstorms) westward in the Pacific.


Moving the convection to the west has huge impact on the rest of the atmosphere, even outside of the tropics.  This is the source of long-range forecast skill with El Nino/La Nina.

Let's look at the change in tropical Pacific sea surface temperatures for the Nino 3.4 region (see map below)


Examining a map of anomalies (differences from normal) reveals that during the past few months, the Nino 3.4 area ocean temps have dropped below normal (blue color).

Just as important, the temperatures BELOW the surface have also cooled. Here are a series of views below the surface at the equator (the x axis in longitude across the Pacific, and the y axis is depth below the surface) for July through now.  Cooler than normal temperatures (blue) have developed.


 Atmosphere/ocean coupled models, such as the National Weather Service CFS, are predicting the tropical Pacific will cool further this winter (see graphic below of several of their predictions in time).
 And with all this input, the official NOAA/NWS Climate Prediction Center forecast for this winter is that La Nina will be observed (see below).


 OK, what does all this imply for the Northwest winter?  Generally cooler and wetter than normal.  More snow than average in the mountains.

Here are some statistics from the National Weather Service for the region encompassing western Washington and the western slopes of the Cascades. The eastern side of the State is similar.

For precipitation, two plots are shown, one for fall (OND) and the other for mid-winter (JFM).  The red line is the mean and 50% of the years are within the blue boxes. The extremes are shown by the "whiskers".    La Nina years tend to be wetter than normal (neutral) and El Nino years.


 What about temperatures?  A bit cooler in the autumn, but much cooler during mid-winter.


 The implications for snow is clear, especially after January 1.... a higher probability of the white stuff, particularly in the mountains.  Yes... a reasonable year to get an annual pass at your favorite ski area.

The strength of this relationship depends on the amplitude of La Nina, and at this point the models are only going for a modest one.  And the La Nina/El Nino connection is not dominant, with natural variability being larger.  Finally, one should NOT expect more precipitation than last winter, which was the wettest on record by several measures.

But after the smoke and heat of last summer, I suspect many Northwesteners are breathing a sigh of relief.  And the upcoming week promises plenty of clouds and rain to get us in the mood.

Should I Let AI Write My Blogs?

I spend a lot of time thinking about and writing my blogs.   Could AI apps do the work for me?   Could any of you tell the difference? Well,...