July 31, 2017

Portland Faces Historic Heat, while Seattle Experiences A Major Heat Wave

The Puget Sound region will have a major heat wave later this week, with temperatures reaching into the upper 90s away from the water, but Portland and the Willamette Valley will face something much more severe warmth--an historic heat wave with temperatures climbing about 105F.  Perhaps, Portland might tie or beat its all-time record:  107F.

Temperatures will progressively rise during the next few days, with Portland leading Seattle on the way up.

The latest UW model forecast, verifying Thursday at 5 PM, tells a torrid story.  Over 104F from Vancouver, WA southward into the Willamette Valley.  Over 100F from Olympia and Shelton southward, and 96-100F around Puget Sound country away from the cool Puget Sound.  Cooler on the coast and over NW Washington.


This situation is one in which Portland will experience severe warmth.  The sea level pressure (solid lines) map for 5 PM Thursday, with surface winds and lower-atmosphere (925 hPa, about 3000 ft) temperatures, show very warm air in the Willamette Valley, with easterly flow over the Oregon Cascades.  Easterly flow will be weaker over western WA, resulting in less downslope warming.  


Some of the forecast guidance is showing crazy warm temperatures this week.  For Seattle (the airport), the National Weather Service GFS MOS (Model Output Statistics), which does a statistical correction to the forecast output, is going for 96F on Wed., 100F on Thursday, and 97F on Friday.  I don't remember ever seeing 100F for MOS at Sea-Tac.


And here is the weather channel (weather.com) forecast for Portland.  109F on Thursday...an all time record (and only 107F on Wednesday... tying the record).


I am a great believer in looking at ensembles (multiple runs of model forecasts) to get an idea of the confidence of the forecast and possible alternatives.  Here are the GFS ensembles (called GEFS) of surface air temperature for Seattle and Portland.  The ensemble average is the black line, and the high resolution member of the ensemble is blue.

 For Seattle, there is a lot of confidence (forecasts are on the same page) that temperatures will get to 94-98F.  Amazingly, temperatures only cool a bit for the subsequent days (to the lower 90s), but it is clear than uncertainty increases substantially (more of a spread in the forecasts).  We are talking about one of the major sustained heat waves in a long time around here.

Seattle GFS Ensemble
The Portland ensembles get into the low-100s, with the higher resolution deterministic run (blue line) rising to around 105.

Portland GFS Ensemble

Keep in mind that we are already slightly past the time for the century temperature records at Seattle.
Below are the three days on record with Sea-Tac Airport getting to 100F or more--all are in the second half of July.  The sun is starting to weaken as the days shorten, so that is working against the high temperatures a bit.
To get more insight into our chances of high temperatures, here are the record daily temperatures (yellow) and normal highs (red line) at Sea Tac Airport.  You can see the peak on July 29th of 103F.  There is a slight downward trend of the high temps in early August, with much cooler peaks in late August.  Then the peaks go up a bit in early September.  

I bet I can explain that...the sun is weakening, but we get more strong offshore flow days, which can cause warming by the compression of air sinking over the western slopes of the Cascades.


My biggest surprise today was seeing some unsold fans in my local supermarket.    I bet they will be gone in two days.  Stay cool.

July 29, 2017

Superheat Coming to the Northwest This Week

If you were thinking about buying a fan this summer, I would hit the stores soon.

If you were thinking of picking up an AC unit, I would take care of that right away.

Big heat is coming to the Northwest later this week, with record breaking temperatures for many, particularly on Thursday, the warmest day.  We are talking about mid to upper 90s F around Puget Sound, and 105-110F near Portland.

During mid-week, a huge ridge of high pressure will build over the western U.S. (see upper level map--500 hPa level--for 5 PM Thursday).


The WRF forecast surface pressure map (with lower atmosphere... 925 hPa, roughly 3000 ft.... temperatures) shows the classic heat wave pattern, with low pressure (thermal trough) extending into western Washington and easterly flow over Cascades.


Take a look at the 5 PM Thursday surface air temperatures (at 2 meters) forecast by the UW WRF model (below).  Mid to upper 90s around Puget Sound (cooler right next to the water) and  over 104F across SW Washington and the Willamette Valley.   I need to change the temperature scale for such heat waves!

Weather.com has excellent forecast and they are going for 95F at Seattle-Tacoma Airport and an AMAZING 110F at Portland.  Keep in mind that this would be higher than the ALL TIME MAX temperature at Portland (107F).

Seattle

Portland

But how confident are these forecasts?  What are the uncertainties?   

As I have described many times in this blog, one should turn to ensemble forecasts (running the model many times with slightly different initial conditions and physics).   Let's start with the best ensemble system, that of the European Center, for Seattle Tacoma Airport.  Their single high resolution forecast is shown by the black line, the mean of the ensemble by the green line, and the spread of the ensembles by the whiskers and green boxes (the whisker are the extremes of the ensembles and the boxes show you the 50 percent of the forecasts closest to the median).

On Thursday, the high-resolution (deterministic) forecast is going for about 97F and the ensemble mean is ABOVE 100F!  Crazy warm.


The US GFS ensemble is peaking around 96F and all the members are very warm.  But one good thing...temperatures will cool down into the 60s at night, so with a good fan you will be able get your rooms cool enough for sleep.
The bottom line of all this information is that we have great confidence of a major warm up, with Thursday heading above 95F. I suspect several locations in the eastern suburbs of Seattle will hit 100F.   And SW Washington, Portland, and the Willamette Valley will exceed the century mark by 5-10F.   And the ensembles show the potential for even warmer conditions.

On second though, perhaps you should run to buy that fan tonight....


July 27, 2017

Drizzle Storm Hits Seattle: One Record Lost

A deepening marine layer this morning resulted in a period of very light drizzle, producing a trace (less than .01 inches) of precipitation at Seattle-Tacoma Airport.

As a result, we have lost the chance for a big record:  the first July or any month without any precipitation at Seattle-Tacoma Airport, a location with data back to 1948.

The visible satellite imagery this morning at 9 AM shows marine clouds over western WA.


And the Seattle Space Needle Panocam shows a very moist, drippy lower atmosphere.

The hourly observations shows the precipitation event (L- indicates very light rain and T means trace). Drizzle started at 6:42 AM and ended 7:29 AM).


Since we had only a trace of rain, we still might beat the big record--the record number of days in a row without measurable rain  (51 days).

Today, we are at day 40.  The latest European Center model ensemble forecast prediction for 24-h precipitation suggests we are on the edge for beating the record, particularly with a potential light event on July 31st when the ensemble mean reaches .012 inches.


Keep your fingers crossed.

July 25, 2017

Major Dry-Day Records May Be Broken

As July approaches its end, it is becoming increasingly likely that Seattle and other northwest locations may break some major records regarding lack of rain:

1.   In Seattle, the first July without a trace of rain and the driest July on record.
2.   The longest run of days without measurable precipitation in Seattle.  (measurable rain means at least .01 inch of rain).  The current record is 51 days and today we have gotten through 38 dry days in a row.

The last month has been quite dry....but it is important to note that this IS the driest time of the year in the Northwest and we are one of driest places in the country during midsummer.  To illustrate the situation, here is the percent of average precipitation for the past month (6/24-7/23).  Much of the western U.S., including western Washington, Oregon, and California,t has received less than 2% of the normal amounts.

Now this sounds very scary, but it really isn't as extreme and impactful as you might think, considering we are now in the West Coast dry season, which enjoys a Mediterranean Climate (wet winter, dry summer).   To illustrate, here is the difference of the precipitation of the past month from normal (climatology).  Most of California and Oregon are less than an inch drier than normal.   Western Washington is the most anomalous, with 1-2 inches below normal.

The origin of our dry period is fairly clear:  persistent high pressure over the West Coast, something illustrated by this graph, which shows the difference from normal of recent upper atmosphere (500 hPa) heights (green/yellow signifies above average).


We are not only dry, but are entering the driest time of the year, as illustrated from this plot of the probability of .01 inch of precipitation in a day.


So what is the forecast?


 Let's start with the best extended predictions:  the 24h precipitation forecasts of the European Center ensemble of 51 forecasts out to 9 August.  The top panel shows the individual precipitation forecasts, with most showing nothing through the end of the month, with only about half showing very light rain during early August.  The bottom panel shows the ensemble mean (or average), which is typically a very good forecast.   

The bottom line:   the July record looks probable and we have a good chance and beating the 51 day record.


To get another view of forecasts, here is the output of the NAEFS ensemble--a combination of the U.S. and Canadian ensemble forecasts--through August 8.  The second panel shows precipitation forecasts (in mm).  Dry though July and a small chance of very light precipitation after August 4th.

More support of us having a real shot at the 51 day consecutive dry-day record.

One interesting issue:  the dry weather has been associated with very little lightning, resulting in only a modest number of wildfires so far.  

July 23, 2017

Personal Fireworks Should Be Banned

In a blog on July 5th,  I asked whether personal fireworks should be banned, noting the huge array of negative impacts.

There was a lot support for doing so, and some of the emails and calls I received were disturbing and emotional.

Two combat veterans called, describing their terror from the concussive sounds in the night.  They told me they were not alone.


I heard from a woman who lost her dog, who had been shaking from fear and hiding in a closet beforehand.

I got an emotional call from a woman whose mother was dying of Alzheimers and was in terror of the explosions, unable to understand their cause.

And I am tired of reading stories of maimed children, destroyed homes, and even a father killed in front of his kids--all due to fireworks.

On July 5th, I was walking my dog at Seattle's Magnuson Park when some teenagers started shooting off rockets in the kite hill parking lot, almost hitting a mother and her kids.

Folks, it is time to end this madness, to make personal fireworks illegal, to seriously enforce this ban, and to leave the pyrotechnics to community displays run by professionals.

The historical perspective

John Adams, in a letter to his wife Abigail, suggested that independence should bring great celebrations "solemnized with Pomp and Parade, with Shews, Games, Sports, Guns, Bells, Bonfires and Illuminations from one End of this Continent to the other..."


And he was not disappointed.  Americans celebrated their independence with large bonfires, cannonade, and volleys from a variety of firearms, with nearly all the action limited to communal celebrations.

The 19th century brought expansion of the celebrations, including increased use of individual fireworks and firearm use.  As a result, the there was a huge expansion of death, injury, and damage, so much so that the American Medical Association and  insurance companies, among others, pushed for restriction of personal displays and more stress on public fireworks and patriotic gatherings. Major restrictions on personal fireworks, fires, and small arms fire was put in place during the early 20th century, and the reductions in deaths and injuries were stunning (see below).   From 466 killed in 1903 to 20 dead in 1912.   


In the 1930s, the Depression resulted in a reduction of public displays and the use of personal fireworks increased.   By the 1950s and early 1960s, increased firework use and a much larger population resulted in a rapid increase in injuries and fires.  The result was a movement towards "safe and sane" fireworks, with smaller explosive charges and restrictions by a number of states.

Recently, there has been a surge in fireworks use, with several states dropping restrictions and a massive increase in imports from China.    Furthermore, "improvements" resulted in louder explosions.     An issue has been the loss of control of fireworks sales in several states and the availability of less "sane" explosives due to unrestricted sales occurring at Native American "boom cities."

Patriotism

I put it to you--is it patriotic to explode loud personal fireworks, when they terrorize or discomfort our combat veterans...the individuals to whom we owe so much?  I don't think so.

Is it patriotic to purchase a product from a foreign nation (China) that pollutes our air, injures at least 10,000 of our citizens a year, burns down thousand of homes or buildings, and sets aflame vast areas of our nation?   In another time, this might be considered an act of war.  In fact, the Japanese tried to do this during WWII using balloon bombs.

Let's be honest, most folks are not shooting off fireworks due to patriotic fervor but rather thrill seeking and entertainment.

Injuries and deaths

Official government statistics indicate that about 10,000 citizens end up at the emergency rooms from fireworks-related injuries, and this is surely undercounting the numbers affected.  Typically, there are around a dozen deaths and hundreds of terrible injuries, including loss of eyesight and blown off fingers or hands. Thousands are burned.  The overwhelming majority of injuries are to young people (see figure below), with 40% of the injuries affecting children of 14 and under.
Non-enforcement and disrespect for the Law

Currently, personal fireworks are banned in a number of Washington State cities, such as Seattle and Bellevue.  But police are not enforcing the ban and if they do catch someone, they just confiscate the fireworks.   Here is a quote (from an article in the Stranger):

Enforcement of firework use is difficult. In order for the Seattle Police Department to give out a citation, they pretty much have to witness someone “holding a match to a firework,” says SPD Detective Patrick Michaud.
“So it becomes extremely difficult for us to get out there and respond in time,” Michaud said, adding that SPD might be able to catch someone lighting up “if we’re lucky.”


Just amazing.

Can you imagine any criminal activity that is EASIER to locate than setting off fireworks?  Big booms, bright lights, screaming sounds and rocket bursts in the air?   How many bank robbers would be caught if they blared loud sounds and bright lights when they were making their heists?   The police are deliberately not enforcing the law and thousand of folks are breaking the law and no one seems to care....this is not a good civics lesson.  It teaches disrespect for the rule of law and cynicism about law enforcement.


I am not suggesting that the police send an army out there and arrest hundreds of people.  But making a clear statement that the law would be enforced, followed by a few hundred citations with a substantial financial penalty would sober folks up rapidly.

Wildfires


What day has more wildfires initiated than any other?    You guessed it...July 4th (see figure below).


According to government statistics, thousands of fires are caused by fireworks each year, involving hundreds of thousands of acres.  Probably not what John Adams was hoping for.


Air pollution

Fireworks seriously pollute the air, endangering folks with lung and heart issues.  In some areas of our state, air quality declines to Beijing levels on the evening of the 4th and July 5th.  Here is a plot of the amount of small particles (the kind that go deep into your lungs) for Tacoma over the past month.  HUGE July 4/5 spike.   Very unhealthy.  Fireworks can and have triggered serious asthma attacks.


I had an interesting conversation with a friend at the Puget Sound Clean Air Agency.   He felt that personal fireworks were much more of a problem for surface air quality.  First, there is more personal fireworks (in terms of amount of material exploded) and personal fireworks are set off at/near the ground, in contrast to the big public displays that send their projectiles high into the air.  And the degradation starts before the official fireworks. Thus, personal fireworks are the main origin of air degradation.  And particles are not the only issue--many fireworks are laced with heavy metals and dangerous chemical (e.g.,  perchlorate).

Terrifying our pets and animal friends

What day of the year do you think the greatest number of pets run away and are lost?  July 4th.  I have had dogs and cats and when the explosions start, their terror and fear are obvious.

So what should be done?

It is time to deal with personal fireworks.   And in my mind, a statewide ban is the best approach. 

 One starts with forbidding sales and use on all non-tribal lands.  And then we ask our native american friends to stop sales on all tribal lands.  Protecting the environment and the land is deeply embedded in native american culture and values.  Surely selling devices that burn our forests and rangelands, pollutes our air, and degrades our waterways (with all the plastics and fireworks-related chemicals) is something they would want to stop.   If not, we could express our displeasure by avoiding their casinos.

Some states have been highly creative in dealing with fireworks.  For example, Hawaii passed a law requiring a license and was only available to adults.   Fireworks use collapsed.

Perhaps one of our political leaders would be willing to take this on.   If not, a community-based group could be formed to lobby the legislature or even or push for an initiative.  There are a lot of environmentally concerned folks in our area....perhaps they will consider giving this issue some priority.

----------------------
Addendum:  Personal Freedom

Several folks opposed a fireworks ban based on the idea of personal freedom.   But there is a difference of a vice that harms only you and one that hurts others.  Fireworks hurt others.  The pollution hurts others.  The fires it causes burns others homes down.  The noise hurts the weak and traumatized.  Etc.   Freedom is important, but one does not have the freedom to harm others.  Smoking is legal, but you can not smoke in a public place where others will be harmed.

And should minors have the "freedom" to purchase and use fireworks?   We deny a 12-year old the freedom to drive a car...that is ok.  Because minors don't have the judgement yet for dealing with the responsibilities and consequences of their actions.   But it is fine for them to use fireworks that can destroy theirs or others lives?

July 20, 2017

What are these clouds?

I received nearly a dozen emails with pictures from folks interested in the clouds apparent around 5-7 PM last night (Wednesday).  Some examples:

Picture courtesy of Nancy Flowers

Picture courtesy of Dyana Stevens

Seattle PanoCam 6PM

What was going on?  Yesterday, a weak front was approaching and this feature was associated with an upper level trough coming off the Pacific (see 500 hPa--around 18,000 ft--map at 5 PM Wednesday).  Such an upper trough causes

upward motion that can promote clouds and instability in the middle troposphere).  In fact,  the vertical sounding at Quillayute, on the WA coast, at 5 PM Wednesday, shows a nearly saturated layer between roughly 500 and 300 hPa (roughly 18,000 ft to 30,000 ft).


As a result, some altocumulus clouds (middle level puffy instability clouds) formed and were vigorous enough to start precipitating out ice crystals.   The long tails of precipitating ice are called fallstreaks or mares tails.   They get distorted and curved by the change of wind with height (wind shear).

So the bottom line is:  folks saw precipitating altocumulus clouds forced by an approaching upper level trough.


Finally, if you want to see an absolutely stunning weather video dealing with clouds and precipitation in Arizona, check this out.   Heroic music, gorgeous imagery....it may bring tears to your eyes.

The Weather of Arizona - A Time Lapse Film from Bryan Snider Photography on Vimeo.

July 18, 2017

Smoky British Columbia and Will Wildfire Smoke Affect Eclipse Viewing?

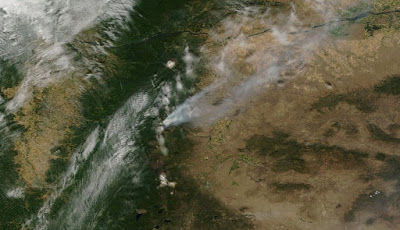
After a recent bout of lightning, a number of major fires were initiated over British Columbia.  As shown by the NASA MODIS satellite imagery over the past three days (see below), the smoke plume have been impressive.


Wildfire/smoke season has begun over the Pacific Northwest, with most of the smoke so far heading eastward.

But the question of many is whether smoke will be a factor during the August 21st eclipse.   There is a lot of talk of folks converging around Madras, Oregon, east of the Cascade crest, but is there a downside to that location: smoke?

To get some insight into this question, here is the climatological probability of a significant wildfire s created by the NOAA/NWS storm prediction center.  A fairly significant chance (10-20%) for a wildfire being around on August 21st around NE Oregon, including the Madras area.

And to illustrate the threat, here is a MODIS image for August 22, 2015, showing a wildfire that spread smoke over the area.


Now smoke will not take out the sun, but it could seriously degrade viewing of the corona and solar prominences.   The lack of rain of the past month is progressively ratcheting up the fire risk for later in the season.   Something to watch.
_____________

Announcement:  Atmospheric Sciences 101

I will be teaching Atmospheric Sciences 101 this fall if anyone is interested either as a UW student or the Access Program for those over 60.  This is a general intro to weather and weather prediction.  MTWTh 10:30-11:20, Kane Hall.


July 17, 2017

Melt Out at Paradise on Mount Rainier

Yesterday, July 16th was melt-out day at the official snow measuring site at Mount Rainier.


Located at roughly 5500 ft, this melt-out day is about 1 week later than typical for the past 100 years (information from Mark Albright, UW Research Scientist).  Here is an interesting table showing the mean melt-out dates by decade at Paradise Mt Rainier:

Decade     Date     No. of Years
----------------------
1910s       16 July     2*
1920s       10 July      9**
1930s        3 July       10
1940s        1 July       10
1950s        17 July       9**
1960s        5 July        10
1970s         21 July      10
1980s        10 July       10
1990s        15 July       10
2000s        10 July        10
2010s         1​6 July      8***

* 1917 and 1918, ** 1925 missing, 1950 missing, *** 2010-2017

As you can see, there is no real trend towards earlier melt-out, which would be a sign of global warming.  That will come, but later in the century.

What about a much lower site?  Such as Stevens Pass (about 4000 ft above sea level)

The snowpack melted out this year on 7 June 2017 at the Stevens Pass SNOTEL site, with the melt-out this year tied for ​11th ​latest out of the past 37 years (the length of record there).

Mean melt-out dates by decade showing a trend towards later melt-out of the snowpack in recent years:

1980s: 30 May
1990s: 1 June
2000s: 2 June
2010s: ​4 June (thru 2017)

Similar to Paradise, the snowpack is holding on later into the warm season.  

 The maintenance of our snowpack into the summer helps maintain our streamflow into the summer, which is good for fish and water resources.   By the middle of the century we expect the situation to change as warming causes more of our precipitation to fall as rain in the mountains.

Should I Let AI Write My Blogs?

I spend a lot of time thinking about and writing my blogs.   Could AI apps do the work for me?   Could any of you tell the difference? Well,...